picture credits: Tracy Green
If you know me, you also know that I never miss the UK Parliament Hackday. This year turned into a joint event between Parliament, the National Audit Office and the Office of National Statistics, AccHack14 has been run over 2 days at the superbly located NAO offices in Victoria. And this year, I’ve won a prize for “Best Parliamentary App”!
I have long been fascinated by Hansard, the archive of Parliamentary debates.
I’m obsessed by Hansard. Hansard keeps me awake at night.
With these words, I’ve opened my presentation. The app I developed is pretty much a tool to search and analyse Hansard in an uncommon way, using a N-grams viewer. N-grams are pretty much sentences of N words. 1-grams are simple words (like “fox”), 2-grams are two words in sequence (like “quick fox”) and so on. The tool I developed, Parli-N-Grams, allows the user to search n-grams in the Hansard corpus, inspired by Google Books Ngram Viewer.
You might ask: why is this a good way to search?
The best kind of search is a search that lets you discover by the simple action of searching.
Searching is about finding a result – in this case, finding a certain debate where a word or sequence of words was mentioned. However, by showing graphically the distribution of those n-grams over the years, Parli-N-Grams also lets the user navigate through the data to discover more:
- how language evolves
- how topics become more important in certain historical periods
- how certain words replace certain other words
and so on.
MPs love to talk about benefits
Try plotting the word benefits:
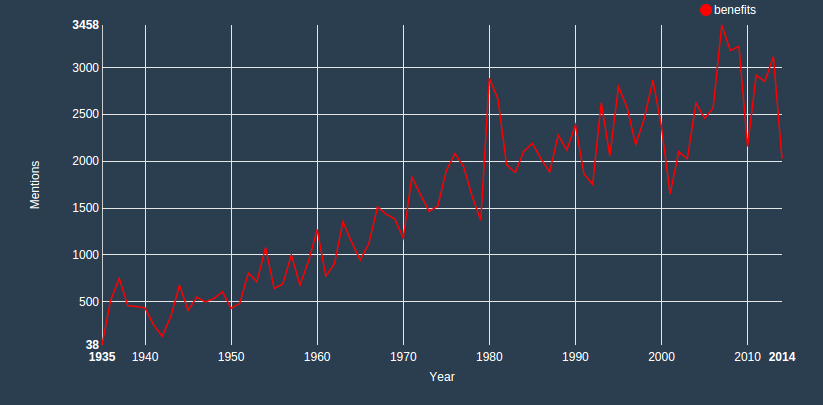
MPs are seemingly using the word benefits in debates more an more. For comparison, plot both benefits and welfare:
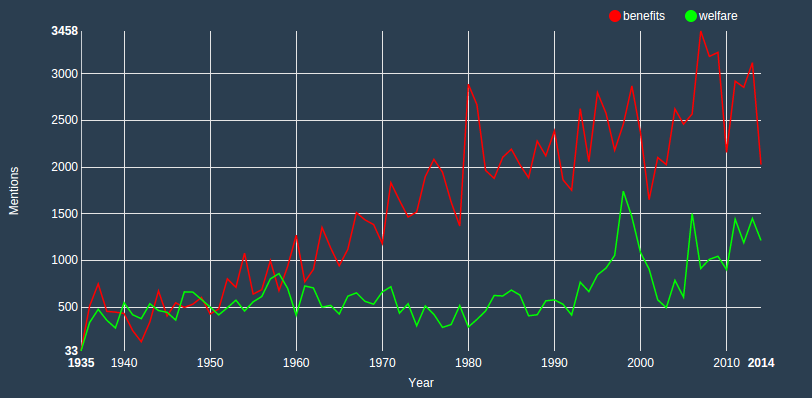
You see how they started pretty much at the same level and then slowly diverge over the years? This is utterly fascinating. Another great example is the word war:
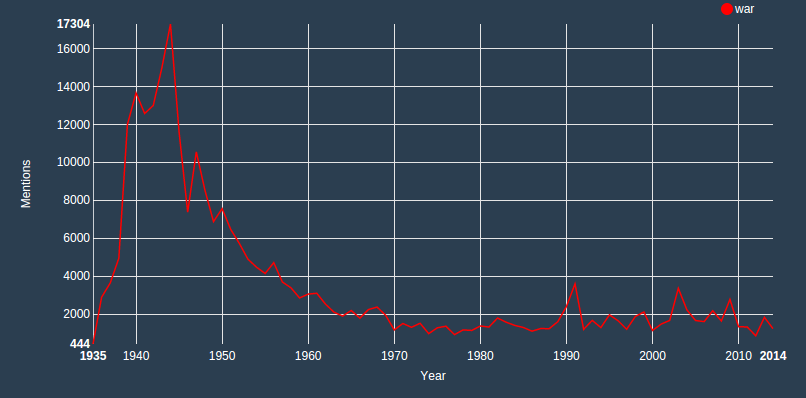
War enters abruptly the political discourse in the late 1930s, when the Second World War became increasingly inevitable, peaks in 1944 and slowly declines. What is really interesting is that not even the repeated military efforts in Iraq (see the peaks in 1991 and 2003) have made the frequency of the word return to the levels seen in the 40s. Are MPs consciously keeping the word war away from the debates? You will remember how the debate was getting heated as to whether the Iraqi War should be defined a “peacekeeping mission”. But it’s not just Iraq: not even the Falklands War (1982) gets a very high peak. If you’re curious, see also “terrorism“.
The way MPs refer to politics is seemingly changing, too. See what happens when plotting the word party:

Here we have a massive spike in 1983, a General Election year. Is it maybe because of the Labour-SDP split? After peaking in 1998 (the year after Labour get back into power) the word seems to decline all the way until peaking again in 2009, just before the General Election returned a hung parliament. Another great use I can envision for Parli-N-Grams is to analyse the evolution of language. See, for example, the distribution of frequencies for basically:
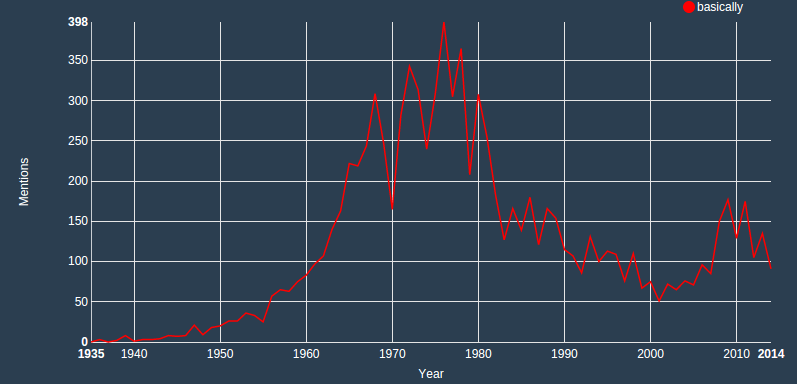
How many other such patterns could we discover?
I need to fix a couple of things…
Parli-N-Grams is intended for social and political historians, and passionate language researchers, but it’s not a stable product yet.
I’m working on it, but be aware that:
- the scripting is a bit rusty, so the website might crash here and then; restart the page if things don’t show up
- my harvesting procedures were done in a rush, in PHP, without being particularly efficient: as a consequence, at the moment Parli-N-Grams only works for 1-grams (i.e. single words)
- during the demo I also showed a nice visualizer for the debate transcripts, but I’ve now disabled this feature; I will re-enable as soon as I decide on a way to efficiently search through the files (ideally using ElasticSearch or similar product)
- I haven’t normalised the results, Google’s Ngram Viewer doesn’t either, and I’m still thinking if it’s more interesting this way or not; I’ll blog about it soon
- more bad stuff that likely escaped me (if you like sed, please have a look at the filter and laugh at me).
Would you like to know which party mentions “benefits” more?
As I’ve said, I’m working to make Parli-N-Grams stable and usable, so that it can be enjoyed by historians, journalists, and whoever shares my obsession with hansard. The roadmap is as follows:
- get Parli-N-Grams to be stable, reactive, working on most browsers
- add 2-grams, 3-grams, 4-grams and 5-grams (I’ll likely stop here)
- add optional segmentation controls; for example, split by political party, to answer questions like which party mentions “benefits” more?
- make the harvesting an ongoing procedure; I would like Parli-N-Grams to update automatically every time we receive new transcripts from Hansard.
- add an API to allow people to embed the charts.
If you have any comment/request/idea, please get in touch. Meanwhile, these are the relevant links:
- Parli-N-Grams website
- presentation slides
- source code
Let me conclude by thanking Nick (National Audit Office), Tracy (UK Parliament) and Matt (Office of National Statistics): you’ve done a great job 🙂 Big credit to the super-smart folks at DXW, who’ve won the overall “Best In Show” prize with a very smart and elegant website investigating housing data, Right-to-Buy-Bye. They’ve also blogged about their experience.