QGIS – An ATLAS of buildings by council
Another little QGIS step-by-step note to my future self.
Prerequisites: This time I was looking to create a visualization of London councils showing the buildings that come from Open Street Map, using the handy downloads from Geofabrik to get the buildings shapefile into QGIS. In order to add the “by council” element, I also downloaded an official shapefile of the boundaries of London councils (e.g. from here) and then joined the two layers using QGIS geoprocessing tools. I’ll leave this to you as exercise, but the final output is a layer with the buildings and a local authority unique ID.
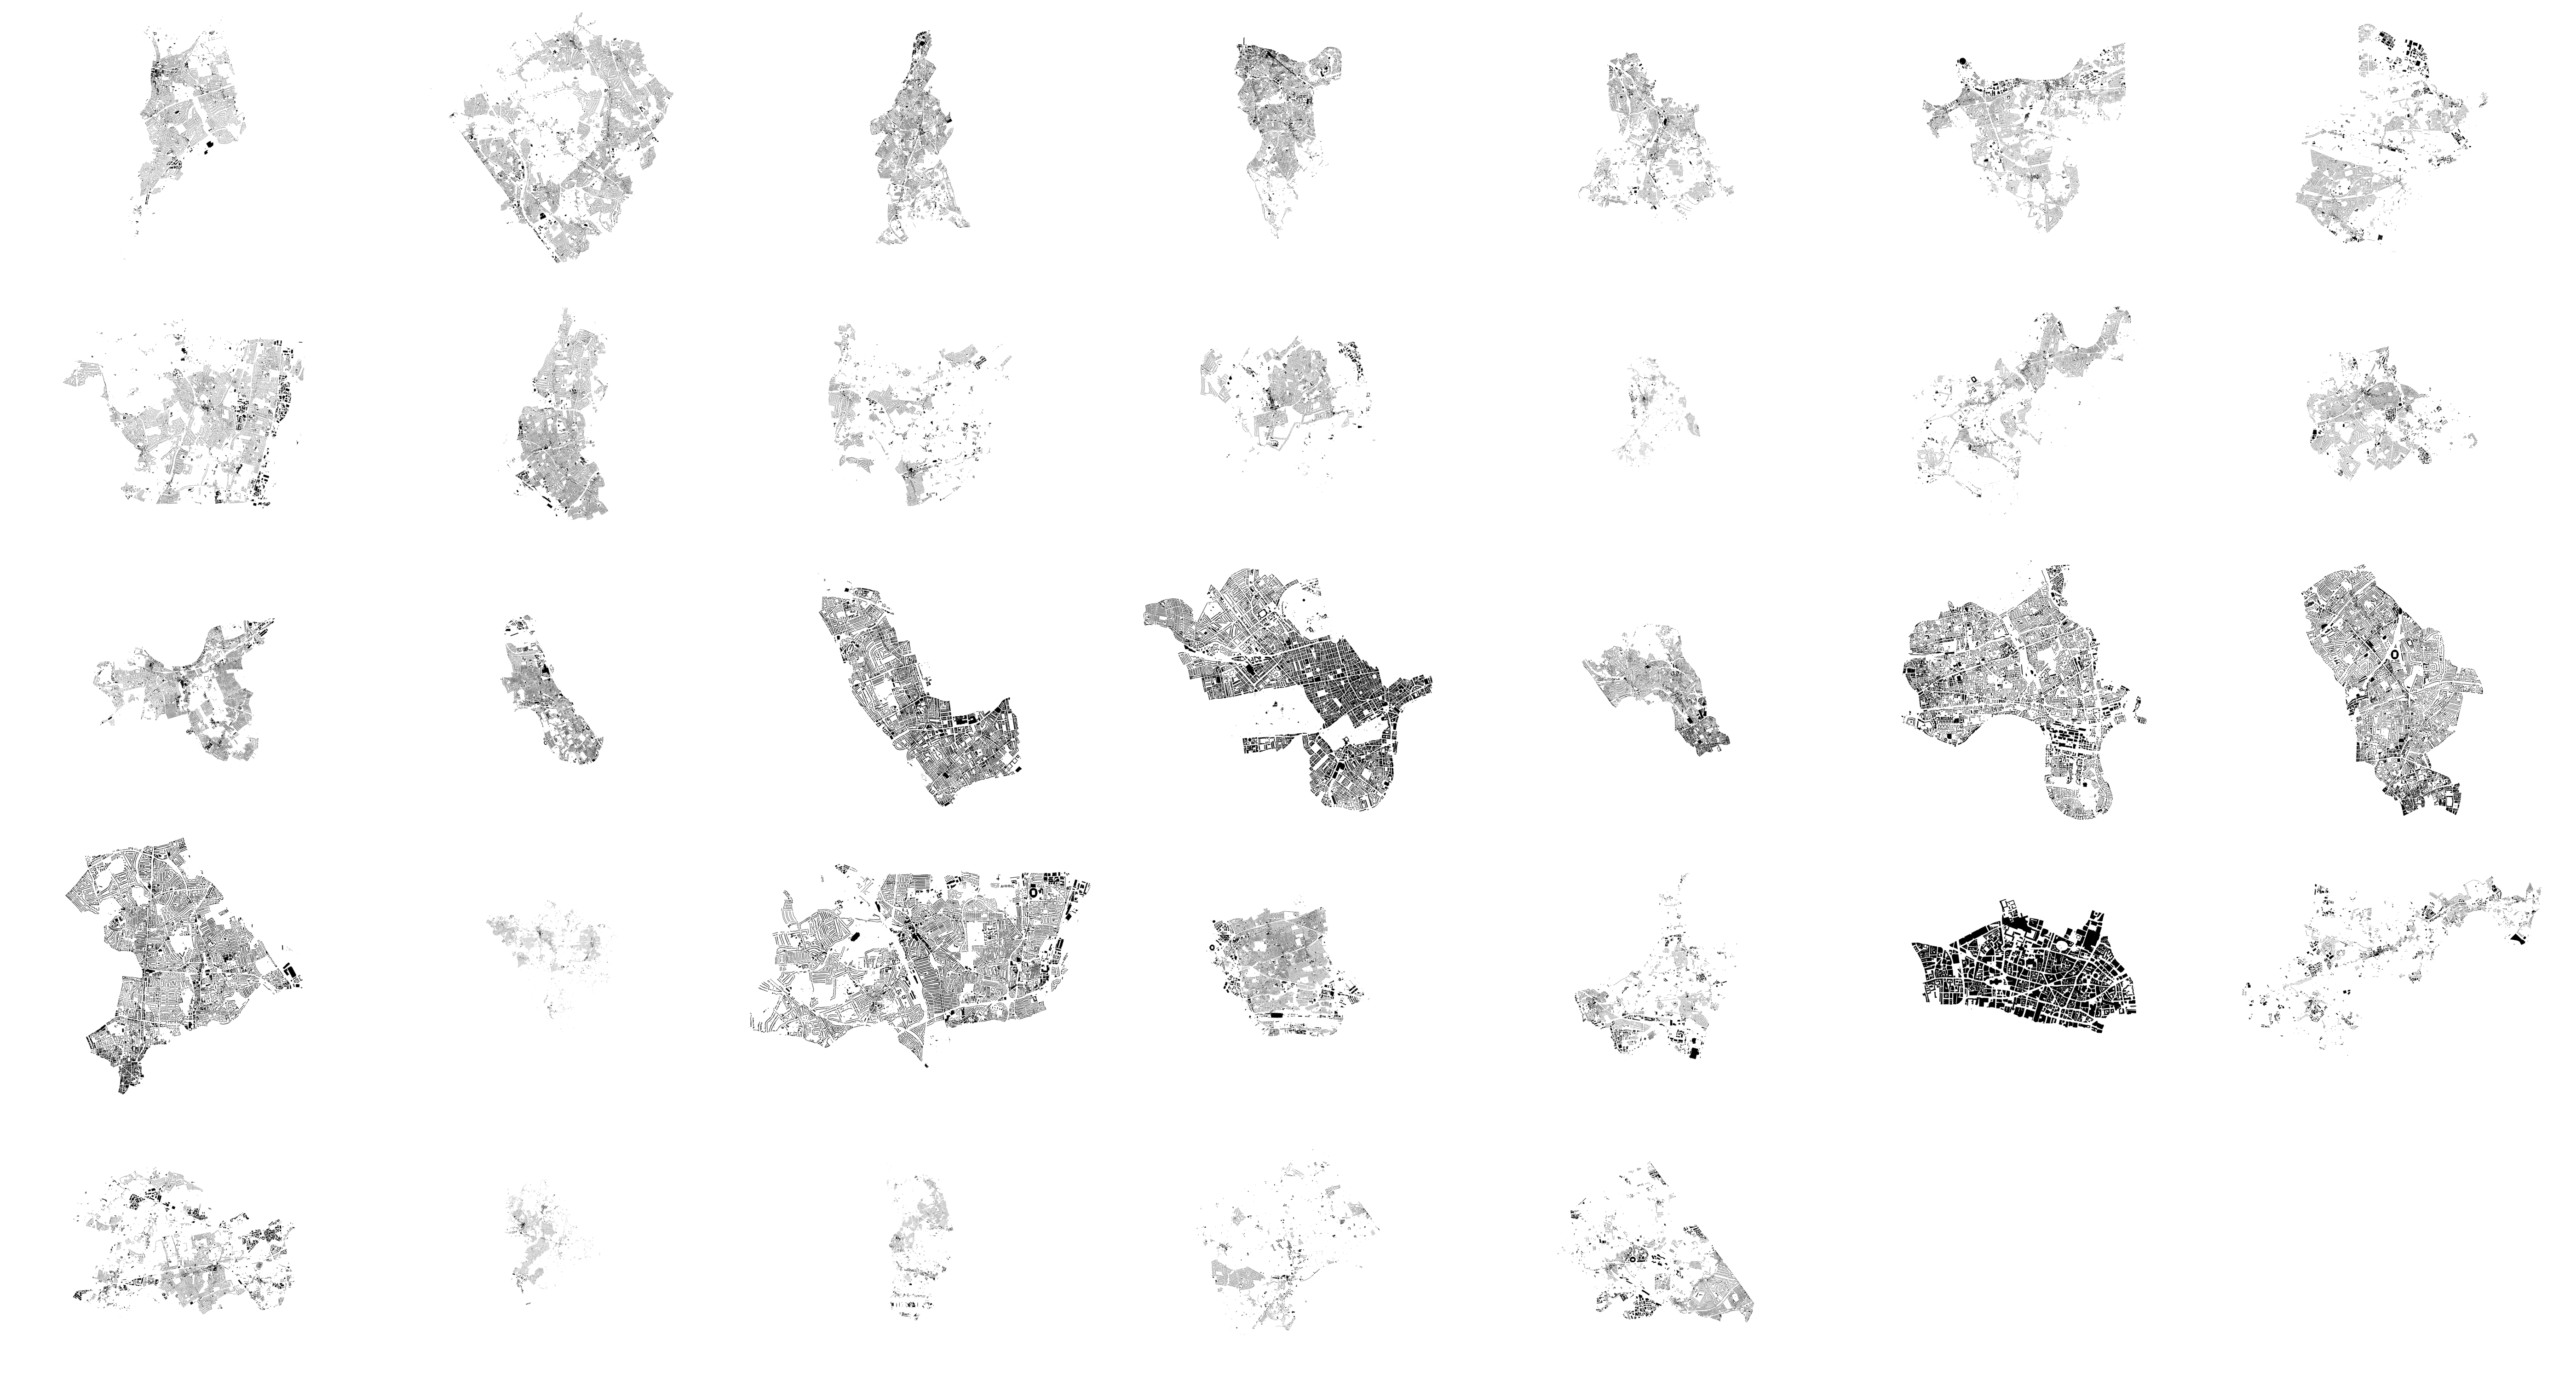
My intended output: one image per council, showing the buildings within that council
The challenge: the shapefile of buildings has one line per feature, with each feature being a building. QGIS Atlas uses, usually, a coverage layer that creates one base per feature, using a specific field. So I need somehow to “group” the buildings by council, or I will get one page per building (and thousands of files).
The solution: we can constrain Atlas to create a page per council by creating an extra layer that contains the boundaries or, more easily, the bounding boxes of each council. We will use this as our coverage layer, but we’ll need to filter out of the initial layer so that it only shows the features that belong to the council being shown.
There are three easy steps required.
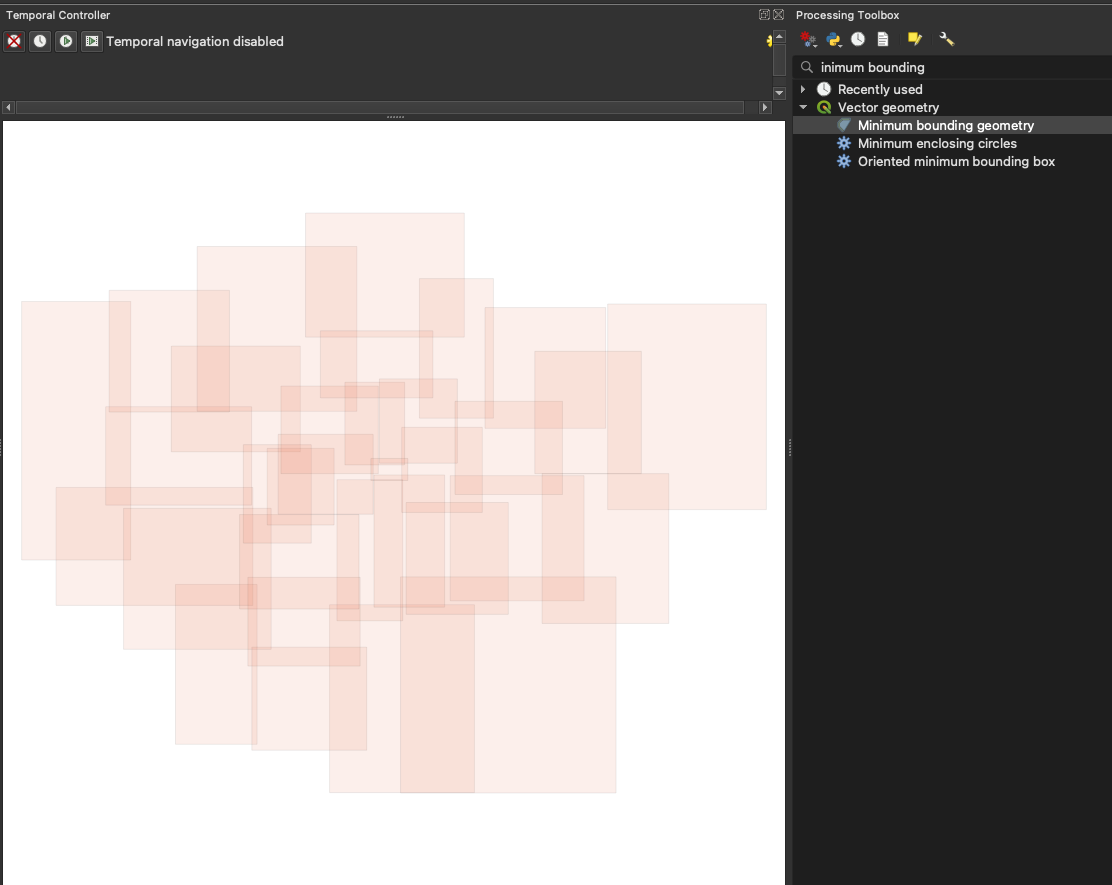
We use the “Minimum bounding geometry” processing tool in order to create a layer with the bounding boxes. The picture below is the result
As you can see from the picture (which I’ve QGIS-styled to look nicely), this just creates a layer that has one feature per council, each feature being a POLYGON with the bbox.
We generate an ALIAS
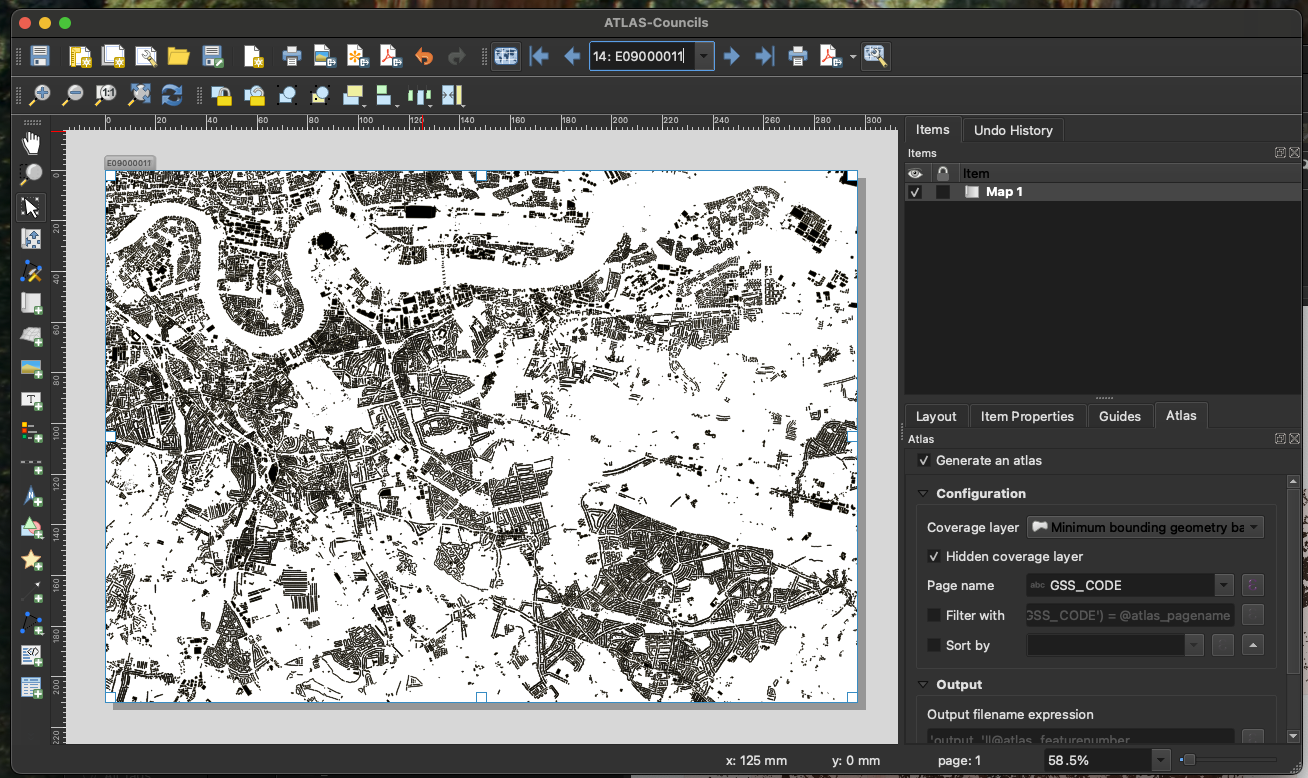
As usual, this involves creating a new Layout, and configuring the Atlas tab by selecting “Generate an atlas”. We will configure it using as “Coverage layer” the bounding box layer just created. But we will also tick the box for a “Hidden coverage layer” and select as page name the field representing the council unique ID.
We will also set “Controlled by Atlas” in “Item Properties” and add a 10% margin arund the feature. This will make all pictures occupy the same space regadless of size. If you wanted, conversely, to preserve size, you coul go for “Fixed scale”.
An example of what this produces is in the picture below: the Atlas, at this stage, is merely “zooming in” on each council, but it’s also showing the buildings that belong to neighbouring councils.
Filter out the buildings… in style
There are multiple ways of achieving the filtering of buildings. The simplest creates a rule-based filter that uses the Atlas itself. You will remember that we’ve set up the Atlas page name to be the council unique ID. We can use this in order to select the buildings.
We go to our layer of buildings and in Properties -> Layer Symbology we set up a Rule-based colouring, adding the following filter to our styling
"GSS_CODE" = @atlas_pagename
which does exactly what it looks like: it selects and styles only those features whose GSS_CODE is the same as the current Atlas page name. Once we apply the rule and reload our Atlas, the same page as before looks like this:
