Categories
geo open data open source

Open Addresses: a great opportunity

The privatisation of Royal Mail came with a massive Open Data defeat, having the Postcode Address File been left within the assets of the sold company. The Open Data User Group – and many others players in this space – voiced their dissent, but the decision had been taken: PAF had to go with the rest of Royal Mail.

It’s time to move on.

The newly funded Open Addresses project is a great opportunity in this context and a Symposium run by the ODI on August 8th has just reinforced my impression that some of the smartest people in the “Open” community are working incessantly to create a credible alternative to PAF (and to Ordnance Survey’s Address-point). Let’s call this OAF.

The Open Addresses Project represents a great opportunity.

First of all, it’s an opportunity to show that crowdsourcing can be as good as a top-down approach, if not better.

We’ve seen this happening with OpenStreetMap. In many parts of the world, the coverage and accuracy of OSM is not just way beyond that of commercial solutions, but it is kept constantly in check by an army of volunteers and users.

Why hasn’t OSM gone mainstream to show the power of crowdsourcing? Primarily because Average Joe doesn’t get that map means archive of location-based data points. Average Joe reads map and thinks Google Maps. “You can’t use OSM” is a common objection, and this misses the point about OSM.

OAF would incur this danger considerably less. Addresses are readily understandable by people, and there would be no confusion about what the database represents.

In an address file, location is an attribute of the address; whereas in a map, address is a attribute of the location.

There is of course another problem of OSM: it is not perceived as authoritative. I remember a discussion with a travelled contact of mine heading to India and looking for maps in constantly changing area. “Use OpenStreetMap”, I said; “it will never be good enough!”, he replied. Except that when he checked, he found out that OSM had more data than any other map available to him.

Open Addresses could definitely risk a perceived lack of authority. Advocacy will play an important role, together with case studies, independent evaluations, and early adopters, in showing that the Open Address File can become the authority in this space.

Secondly, this is an opportunity for Royal Mail and Ordnance Survey to review their practices about addresses and to improve their own products by providing users with an independent way to assess their quality. It’s maybe an opportunity for them to finally and uncontroversially understand that Openness is a way to increase their business influence – and revenues – and not a way to jeopardise it.

There are unquestionably several challenges ahead, both technical and non-technical.

The technical challenges can be easily enumerated: what is an address? What is the minimum unit of space we want to represent? Where do we stop – street level, floors, flats, units, rooms? None of these will be easy to solve, but the beauty of this project is in its process that intends to bring together addressing experts with users of addresses.

However, considerably more challenging will be the cultural problems children of the monopoly of Royal Mail and Ordnance Survey in this space, the myths about what PAF could deliver and the reliance on restrictively licensed products that might hinder the smooth transition to an open product.

Let me mention some of these cultural challenges:

  • PAF was built as a way to allow postmen to deliver post; it’s a collection of delivery points, not a way to identify buildings, houses, or business premises, although some users have come up to intend it this way; OAF will need to re-state its goals and make them easy to understand for its users
  • PAF can be authoritative in the minds of its users, but it’s not as accurate as they generally believe: duplications and errors are rather common; OAF has the opportunity to be more accurate and have more coverage and will need to be up to this for at least a number of clear use cases. Let me quote ODUG’s response to the PAF consultation:

Royal Mail usually states the completeness of PAF (the principal measure of quality) as being in excess of 98%. However, as Royal Mail determines what a delivery point is, no external body can identify missing delivery points to confirm that measure.

  • evidently, there is no benchmark to assess the quality of PAF; OAF will need to be built in a way that makes this assessment possible and desirable to its users
  • feedback loops will need to be clear, i.e. how to allow third parties to add addresses into OAF
  • the NLPG is often hailed as a solution, when in fact is just another face of this problem, coming with restrictive licensing

All of these issues are difficult, but not unsolvable. I believe that early adopters will play an important part in advocating this new data product, showing that it’s not just as good as the existing commercial not-really-open solutions, but better in terms of reliability, accuracy, coverage.

Most use cases of an address file revolve around the function of address lookup. As such, they come with a great feature: they immediately detect if an address is missing or incorrect. Feedback will play a relevant part in the process envisioned to build Open Addresses.

Hence, let me close with an appeal: if you use addresses in your business, for your job, for marketing purposes, keep an eye on this project and start building your services in a way that allows you to use an Open Addresses file.

Categories
geo

Highlights from WhereCampEU 2012

UPDATED: added the names of two speakers: Hugues Bouchard and Diego Arechaga.

We learn from Ed Parsons, Google’s Geo man, that Google Maps and OSM are not fierce enemies. Au contraire, “Google wants OpenStreetMap to succeed“. So I took a picture of Ed presenting OSM, announcing it cheekily as “Ed’s defection to OSM” (no, that’s not true).

All of this might have earned him the title of Saint Parsons (thanks, Henk Hoff).

I agree on one thing: Google Maps and OSM are not competitors. OSM is a database providing geographical data. You can use it to create a cartographic rendering, but it’s not its main goal. People seem to forget it.


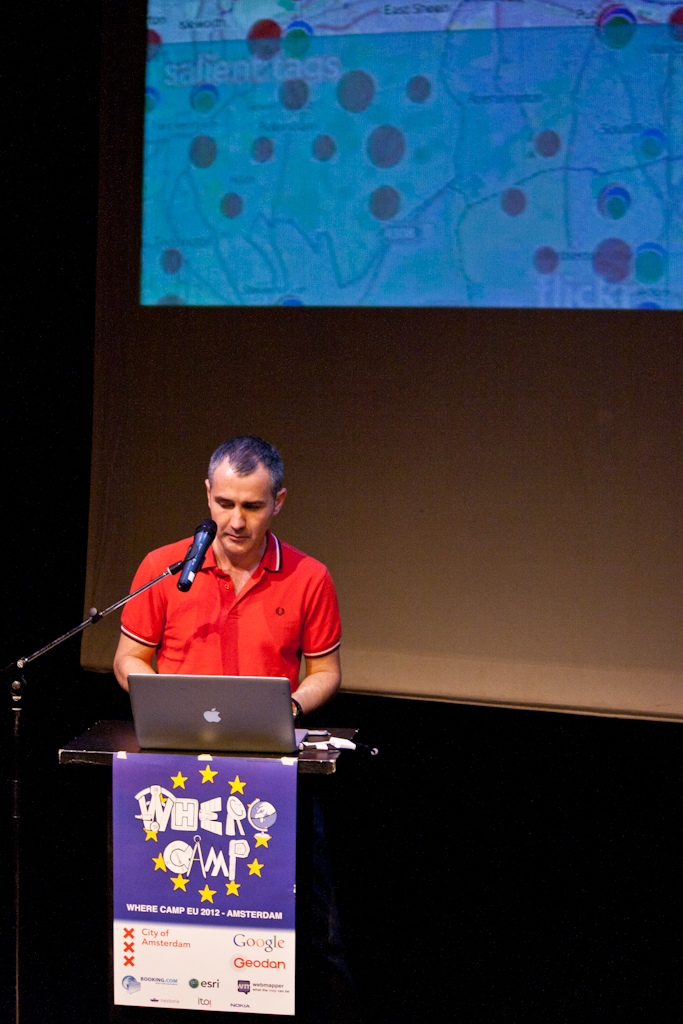
Yahoo’s Adam Rae showed how you can use Scale Spaces theory to infer regions in a map from the geographical distribution of tags. Although Adam’s results are great in their own right, and the mere ability of detecting boundaries via tags is a fascinating possibility, I find this extremely interesting also for its implicit dynamism: tags about a location can change.

Ethnographers who wish to learn how the perception of what is a place, how a place changes, or how the boundaries of a location are fluid, might use this technique. This is true in space and time. An interesting, although intended to be funny, example of such perception shift is http://thisisntfuckingdalston.co.uk showing that the boundaries of a place change according to a spatial component. Moreover, a temporal component might be added to the model, assessing how people’s perception of a given place changes over time. Take, for example, an expanding neighbour.


Jan Nowak, an engineer at Nokia, showed how Nokia Maps API can be used to go “from data to meaning in 20 minutes“. Someone complained that “Nokia doesn’t do anything that Google hasn’t already done“. I don’t think this holds true: first of all, there are some genuinely innovative UI elements in Nokia Maps (see WebGL). But more importantly, they are adding a great element of competition to already existing services. Even if Nokia Maps were just yet another map service, with comparable features to Google’s, that would be beneficial to developers and to the geo community at large. It’s a challenge that will bring innovation. Why complain?


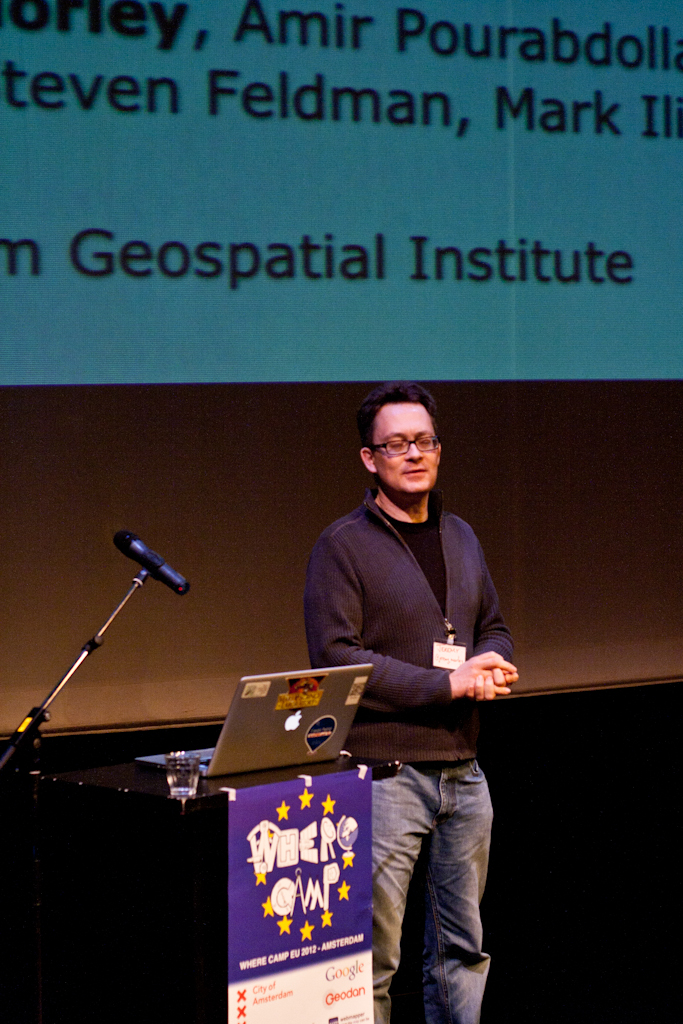
Jeremy Morley from the University of Notthingham gave the attendees the last updates about the OSM-GB project, whose aim is to measure and improve the quality of OpenStreetMap in Great Britain. This is a very interesting project with very useful outcomes both in the academic and applicative areas. The project aims to answer questions such as how authoritative a crowd-sourced map can be, and to show how multiple sources, including crowd-sourced maps, can be used together to improve the overall quality of the geographical information. One very important aspect of this project is exactly its contribution to OSM happening at the same time as offering a model for updates to non-crowdsourced mapping efforts.


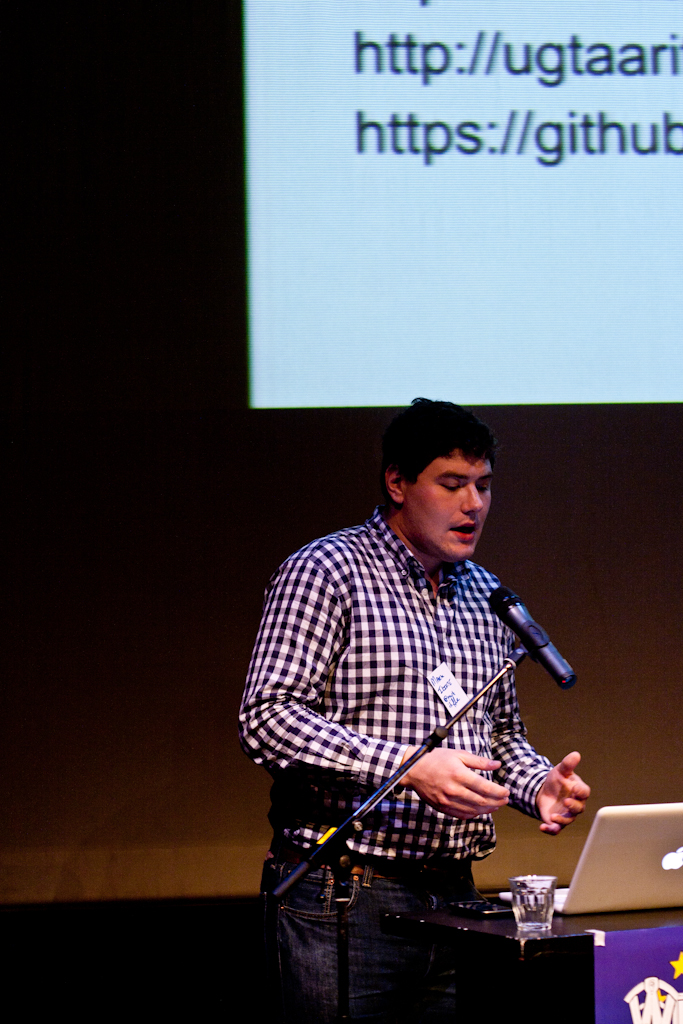
Having contributed to the project and to the presentation, I’m very happy with the reception that Taarifa has received, mostly thanks to a great presentation by Mark Iliffe, a PhD student at the University of Nottingham. His public engagement skills are well known and they earned Taarifa promises of contribution by many of the people attending. There was also a mini hack-session with over 10 people willing to discuss Taarifa and envision ways to improve it and put it to good use.


Day two opened with Jan Van Eck telling the audience why Esri is interested in Where Camp and how they think they can contribute to the geo-computing community.

He showed some of Esri’s work in the area of maps production and user experience, with the goal of making a case in support of their philosophy, not always in tune with that of OpenStreetMap. However, it must be said that Esri’s contribution to the perception in the public of the existence of a “geographical issue” is certainly a big one.


Another interesting piece of work by Yahoo, led by Vanessa Murdock with contributions by Hugues Bouchard and Diego Arechaga (pictured below), showed how hash tags can be used to infer hyperlocal trends, similarly to what Adam presented earlier on.


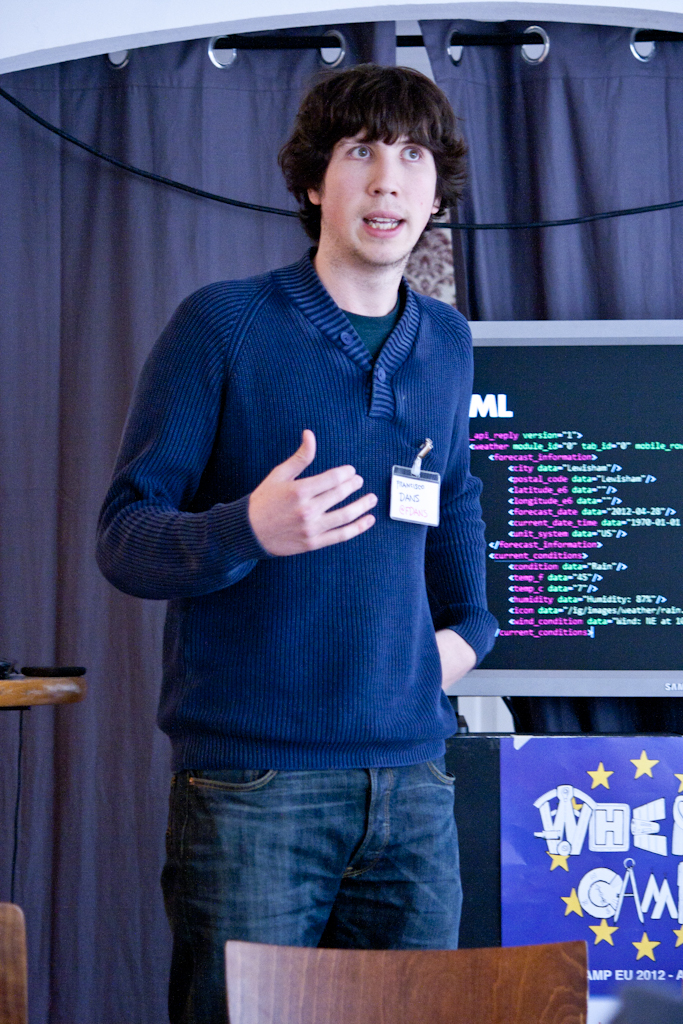
Goldsmith’s design student Francisco Dans led a very practical session about real-time data crunching with map displaying as a result, with tricks and tips on how to use Processing to parse xml/kml. He showed how he used this framework to display trams in San Francisco on a map in real time. Francisco advises using UnfoldingMaps as a tool to create interactive thematic maps and live geovisualizations.


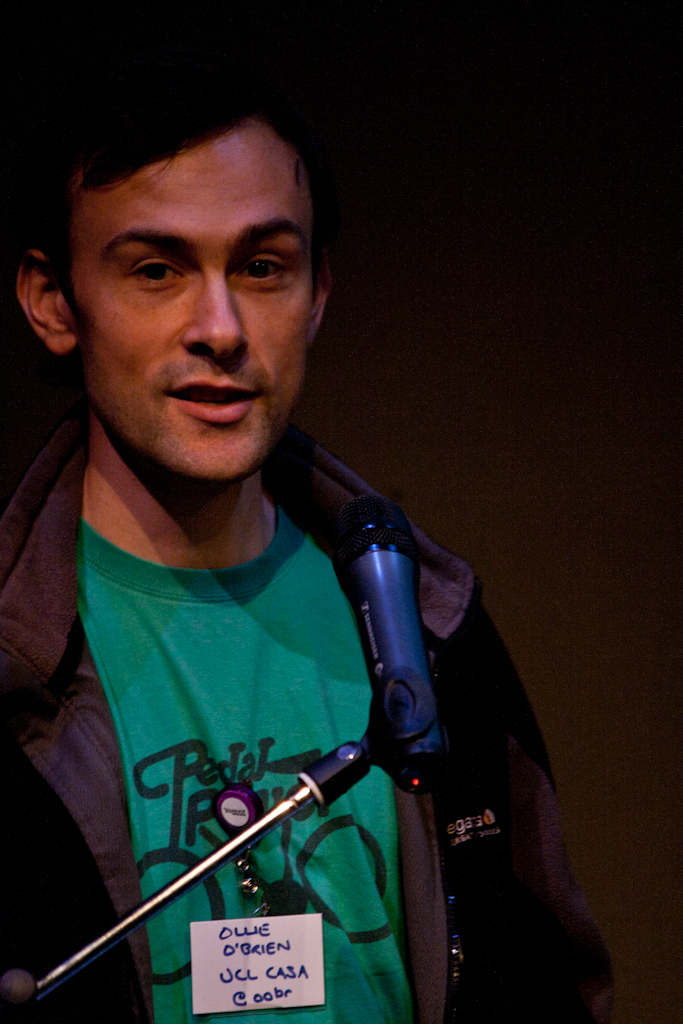
Ollie O’Brien is a well known attendee of WhereCamps and Geomobs, working as a Research Associate at CASA. He introduced his recent work on creating City Dashboards: web aggregators of several data sources about a single city. These are extremely useful central points of information for citizens and tourists. Ollie also showed a fun and mind boggling piece of software, developed at CASA, that allows users to fly the sky as they were pigeons. Using a Microsoft Kinect controller and Google Earth, the user can “play” with the system by flying among building using gestures.


Laurence Penney is always aggregating the more “cartographicals” of us at his enlightening talks. This time, he came up with a very insightful talk about unidimensional (or linear) maps. A good example of such maps is the Trajan’s Column in Rome, which tells a story in time and space on a single dimension. Of course, a similar technique can be used to represent geographical information. In the past such maps have been used by seamen as “rolling maps“, in a way not too dissimilar to what current GPS navigators do, by displaying what your next step is. What was very interesting in Laurence’s talk is how he conveyed the high aesthetical value of these maps.

There were many other open discussions, including Nutiteq‘s Jaak Laineste showing their latest SDK, useful to create and navigate 3D maps, and ITO World‘s Peter Miller showing how ITO uses and contributes to OSM by adding layers of data. Philip Kandall of Skobbler introduced some advanced routing features (“routing from A to B is boring“) that will be in future navigators, including route calculation by time available for the journey (i.e. not as a maximum time, but as a minimum).


As traditional for WhereCamps, a couple of light-hearted moments have closed the unconference: Tim Waters‘ geo-yoga, involving stretching positions that mimic country shapes (I guess we can work on a KML representation of such positions?) and Mark Iliffe’s Geo-Locating Geobeers, suggesting how the Taarifa Platform can be used to report beer drinking location and level of… happiness.

(full set of photos http://www.flickr.com/photos/puntofisso/sets/72157629552681824/)

Categories
geo gov mobile my projects open data open source policy

Outreach and Mobile: opening institutions to their wider community

[Disclaimer: this post represents my own view and not that of my employer. As if you didn’t know that already.]

Do the words “mobile portal” appeal to you?

I have been working extensively, with a small team, to launch St. George’s University of London‘s mobile portal since last January after we decided to go down the road of a web portal rather than that of a mobile app. The reason for this choice is pretty clear: despite the big, and growing, success of mobile apps, we didn’t want to be locked in to a given platform or to waste resources on developing for more platform. Being a small institution it’s very difficult to get resources to develop on one platform, even less on multiple ones. We also wanted to reach more and more users, and a mobile portal based on open, accessible, resources made perfect sense.

As many of the London-based academic institutions, St. George’s needs to account for two different driving forces: the first is that as an internationally renowned institution it needs to approach students and researchers all over the world; the second is that being based in a popular borough it is part of the local community for which it needs to become a reference point, especially in times of crisis. Being a medical school, based in a hospital and a quality NHS health care structure, emphasizes a lot the local appeal of this institution.

This idea of St. George’s as an important local institution was one of the main drives behind our mobile portal development. We surely wanted to provide a good, alternative, service to our staff and students, by letting them access IT services when on the move. However, the idea of reaching out to people living and working around us, to get St George’s better known and integrated within its own local community, lead us to a thriving experience developing and deploying this portal. “Can we provide the people living in Tooting, Wandsworth, and even London, with communication tools to meet their needs, while developing them for people within our institution?” we asked ourselves. “Can we help people find more about their local community, give them ideas for places to go, or show them how to access local services?“.

This coalition government had among its flagship policy that of a “Big Society”, having the aim “to create a climate that empowers local people and communities”. Surely a controversial topic, nonetheless helpful to rediscover a local role for institutions like us to get them back in touch with their own local community, which in some case they had completely forgotten.

In any London borough there are hospitals, universities, schools, societies, authorities. No matter their political affiliation, if each of these could do something, they would improve massively the lives of the people living within their boundaries. Can IT be part of this idea? I think so. I believe that communication in this century can and does improve quality of life. If I can now just load my mobile portal and check for train and tube times, that will help me get home earlier and spend more time with my family. If I can look up the local shops, it will make my choices more informed. It might get me to know more local opportunities, and ultimately to get me in touch with people.

Developing this kind of service doesn’t come with no effort. It required work and technical resources. We thought that if we could do this within the boundaries of something useful to our internal users, that effort would be justified, especially if we tried to contain the costs. With this view in mind, we looked for free, open-source, solutions that we might deploy. Among many frameworks, we came across Mollyproject, a framework for the rapid development of information and service portals targeted at mobile internet devices, originally developed at Oxford University for their own mobile portal. When we tried it for the first time, it was still very unstable and could not run properly on our servers. But we found a developers community with very similar goals to ours, willing to serve their town and their institution. We decided to contribute to the development of the project. We provided documentation on how to run the Molly framework on different systems, and became contributors of code. Molly was released with its version 1 and shortly afterwards we went live.

Inter-academic collaboration has been a driving force of this project: originally developed for one single institution, with its peculiar structure and territorial diffusion, it was improved and adapted to serve different communities. The great developments in the London Open Data Store allowed us to add live transport data to the portal, letting us have enthusiastic reactions from our students, and these were soon integrated in the Molly project framework with great help from the project community. I think this is a good example of how institutions should collaborate to get services running. A joint effort can lead to a quality product, as I believe the Molly project is.

The local community is starting to use and appreciate the portal, with some great feedback received an the Wandsworth Guardian reporting about a “site launched to serve the community”. I’m personally very happy to be leading this project as it is confirming my idea that the collaborative and transparent cultures of open source and open data can lead to improved services and better relationships with people around us, all things that will benefit the institutions we work for. The work is not complete and we are trying to extend the range of services we offer to both St. George’s and external users; but what we really care and are happy about is that we’re setting an example to other institution of how localism and a mission to provide better services can meet to help build better communities.

Categories
geo Web 2.0

Wherecamp, Therecamp

Disclaimer: This is a dashboard/notepad-like stream of ideas and questions, rather than a proper blog post 🙂

WherecampEU, Berlin

An amazing time with some of the best minds around. Some points I’d like to put down and think about later:

1) Ed Parsons (@edparsons) run a very interactive session about what kind of open data developers expect from public authorities and companies. One of the questions asked was “would you pay to get access to open data?“. This issue has long been overlooked. Consider for a moment just public authorities: they are non-profit entities. Attaching an open license to data is quick and cheap. Maintaining those data and making them accessible to everyone is not. As developers and activists we need to push the Government to publish as many data they can. However, we want data to be sustainable. We don’t want to lose access to data for lack of resources (think about Tfl’s TrackerNet). Brainstorming needed…

2) Gary Gale (@vicchi) and his session on mapping as a democratic tool can be reduced to a motto: We left OS times, we are in OSM times. Starting from the consideration we don’t talk about addresses but about places, part of the talk was dedicated to the effort Gary and others are putting into defining a POI standard. The idea is to let the likes of Foursquare, Gowalla, Facebook Places, etc…, store their places in a format that makes importing and exporting easy. Nice for neogeographers like us, but does the market really want it? Some big players are part of the POI WG, some are not.

3) I really enjoyed the sessions on mobile games, especially the treasure hunt run by Skobbler. However, some of these companies seem to suffer from the “yet another Starbucks voucher” syndrome. I’m sure that vouchers and check-ins can be part of a business plan, but when asked how they intend to monetize their effort some of these companies reply with a standard “we have some ideas, we are holding some meetings“. Another issue that needs to be addressed carefully – and that seems to be a hard one – is how to ensure that location is reported accurately and honestly. It doesn’t take Al Capone to understand you can easily cheat on your location and that when money are involved things can get weird.

4) It was lovely to see Nokia and Google on the same stage. Will it translate in some cooperation, especially with respect to point 2)?

5) I can’t but express my awe at what CASA are working on. Ollie‘s maps should make it to the manual for every public authority’s manager: they are not just beautiful, but they make concepts and problem analysis evident and easy to be appreciated by people who are not geo-experts. And by the way, Steven‘s got my dream job, dealing with maps, data, and RepRap 😀

6) Mark run a brainstorming session about his PhD topic: how to evaluate trust in citizen reported human crisis reports. This is a very interesting topic, and he reports about it extensively on his blog. However, I’m not sure this question can have a single answer. What I feel is that different situations might require different models of trust evaluation, to the point that each incident could be so peculiar that even creating categories of crisis would result impossible. Mark’s statistical stance on starting his work might return an interesting analysis. I’m looking forward to see how things develop.

7) Martijn‘s talk about representing history in OpenStreetMap exposes a big problem: how to deal with the evolution of a map. This is important from two points of view: tracing down errors, and representing history. This problem requires a good brainstorming session, too 🙂

8) Can’t help but praise Chris Osborne for his big data visualisation exposing mcknut‘s personal life 🙂 And also for being the best supplier of quotes of the day and a great organiser of this event, as much as Gary.

What didn’t quite work

Just a couple of things, actually:
1 – live code presentations are doomed, as Gary suggested. They need better preparation and testing.
2 – no talk should start with “I’ve just put these things together”. Despite this being an unconference, that shouldn’t mean you want to show something bad quality. Or anyway give that impression.

Me wantz

Next time I wish to have:
1 – PechaKucha-style lightening presentations on day 1, to help people understand what sessions they want to attend
2 – similarly to point 1, a wiki with session descriptions and, upon completion, comments, code, slides, etc…
3 – a hacking/hands on/workshop session, on the model of those run at #dev8d.

Categories
geo geomob mobile Web 2.0

GeoMob, 12 May 2011

A good level of participation for yesterday night GeoMob. Despite two speakers’ defections we had a well balanced schedule (one big company, one researcher, one startup) and a rich Q&A session. Here’s my usual summary with some thoughts embedded.

Microsoft Bing Maps, by Vikas Arora (@vikasar), Solution Sales Specialist
General show-case talk as we often have from big companies. However, some interesting products seem to be coming out of the Microsoft pipeline, especially StreetSlide and the partially related Photosynth. Some awesome novelty (although not immediately usable) like the amazing live Augmented Reality video stream on a static image view. I’m not totally sure the GeoMob crowd is the right one to show AR 😉

There was some good debating about updating StreetSlide imagery, thanks to a question by Ollie. This is a well known problem in Google StreetView, especially in busy London High Streets where shops sometimes change hands multiple times in a year. As a result, by the time StreetView imagery has reached Google’s servers it displays a vintage version of reality. Vikas claims that by partnering with Navteq they will be able to update images every 4-6 months.

Vikas earns the best quote of the night award: “I can’t say much about Nokia except that it’s good for us”.

Mapping Surnames Geographically, by James Cheshire (@spatialanalysis), UCL Geography
I was absolutely fascinated by James’ work upon discovering it on the National Geographic Magazine some months ago. The general subject of this talk is showing how surname origins and popularity can be displayed on a map. Two works were presented about surnames in the US and in London.

The talk and the Q&A session highlighted both the power of a map to show surnames but also its limitations. There are obvious problems of visualization: short and long surnames being displayed in different size, choice of colours, positioning, density, granularity.

Although the map itself is a beautiful item, I think that its dynamic version, able to show the nth most popular surname, is more useful, but only if used… dynamically. What I mean is that in places that are true melting pots like London what it’s interesting is not what surname or surnames are the most popular, but rather what’s the distribution of names of a certain origin in a given place. In other words, given the assumption that certain surnames can be related to certain communities, it’s interesting to see that the first five most popular in a given area are sometimes from five different origins.

James was open about the issues of visualising surnames this way, especially about how to treat granularity (e.g. the Irish community in New York is not as big as it would be). There is lot of work to do in this area and a map is only the tip of the iceberg of research, development, coding, and imagination.

Introducing Eeve, by Jan Senderek (@jansenderek)
Impressive UI analysis for this young start-up whose goal is to let people have fun creating and sharing events. Jan, their CEO, delivered a very interesting talk about how UI can lead to a great mobile application. Their strategy of “mobile first, then web” is interestingly different by that of many other startups around. Event creation and sharing seems to have a mind-boggling peculiarity: initially, events will need to be created in the place where they will be held and shared immediately. No forward planning allowed, which sounds strange but might capture the fantasy of party goers. They plan to extend the service to let event organisers create entries.

The (long) Q&A session seemed critical but was truly interested. First of all, turning myself into the bad guy, I asked what makes them different from their competitors. I’ve attended GeoMob since 2009 and this is at least the third company introducing a similar service, and their unique selling point is not extremely clear. Surely, UI seems to be really good for their app, but is that enough to get to that critical mass of users needed to succeed?

Secondly, the business model seemed not very well defined. Although as any stealth startup Eeve wouldn’t probably disclose too much about it, the general perception was that they need to think about it a bit more accurately, and Jan admitted that.

However, I also have the general impression that small companies presenting at GeoMob (not just Eeve) tend to come just with their shiny iPhone application rather than with the backstage work which might be of great interest. This also gives the wrong impression that most of them are trying to monetise upon nothing more than a mobile app. As it turns out, one of the other LBS introducing at GeoMob a similar event-based app was also selling a CRM system to event organisers which is where their main revenue stream comes from. None of this was mentioned at the presentation and we were left wondering with the same questions.

I won’t mention all the discussions about stalking and privacy: we’ve done that for all companies providing LBS, so nothing new from that perspective. But it’s always good to have our @StevenFeldman pointing that problem out.

To be honest, I’m curious about Eeve and will probably try it out (paying attention to privacy, of course :P). It would be nice to have a report on how many users join the system and especially their B2B strategy.
Maybe for a next GeoMob?

Categories
geo geomob

The several issues of geo development: a chronicle of October’s GeoMob

GeoMob has returned after a longer-than-usual hiatus due to other – and definitely very interesting – commitments of our previous Mr GeoMob, Christopher Osborne. It was a very interesting night with the usual format of four presentations covering aspects of research, development and business. Here’s my summary and comments.

Max Howell, @mxclTweetdeck

I’m a bit unsure on how to comment the involvement of TweetDeck into the GeoSocial business.
Max’s presentation has been focused on the integration of their application with FourSquare. It’s a tightly coupled integration allowing users to follow their Twitter friends using the locative power of Foursquare, i.e. putting them on a map. Max gave out some bread for our brains when commenting that “Google Latitude is not good for us because it gives out location continuously, whereas we are looking for discrete placement of users on POIs“: this is a real example of why more-is-not-necessarily-better and, in my opinion, the main reason for which, to date, Latitude has been less successful in catalysing users’ attention on locative services.

However, I’m not totally sure why TweetDeck foresees its future into becoming a platform to integrate Twitter and FourSquare into a single framework. “Other apps put FourSquare functions in a separate window and this is distasteful“. Is it really? And how exactly will TweetDeck benefit, financially but not only, from this integration? “We spent a lot of time on FourSquare integration but unfortunately it’s not much used“. They should ask themselves why.
Their TODO list includes Geofencing which might be interesting so let’s wait and see.

Matthew Watkins, @mazwat Chromaroma by Mudlark

For those of you who don’t know it yet: Chromaroma is a locative game based on your Oyster card touch-ins and touch-outs. They’re still in closed alpha, but the (not so many?) lucky users (I’ve asked to join the alpha 3-4 times, but they never replied) can connect their Oyster account to the game and take part to some kind of Gowalla for transport, based on the number of journeys, station visited, personal and team targets.

Two things to be considered:
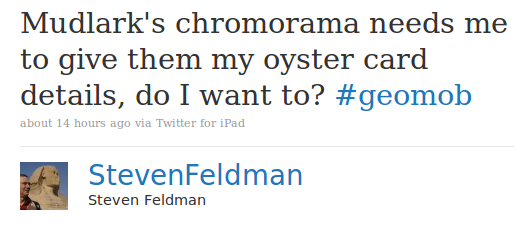
open data and privacy: upon joining the service, the user account page is scraped for their journeys. Matthew explained they approached TfL to ask for APIs/free access to the journeys data but “due to budget cuts we’re low priority“. Apparently they’ve been allowed to keep on doing scraping. The obvious issue is a matter of trust: why should someone give their oyster account access to a company that, technically, hasn’t signed any agreement with TfL?
This is worrying, as to get journey history data you need to activate Auto Top-up. So you’re basically allowing a third party to access an account connected to automatic payments from your payment card.
Secondly, I can’t understand TfL’s strategy on open data here: if they are not worried about the use Mudlark is doing of such data, why not providing developers with an API to query the very same data? Users’ consent can be embedded in the API, so I’m a bit worried that Chromaroma is actually exposing the lack of strategy by TfL, rather than their availability to work together with developers. I hope I’m wrong.
monetising: I’m not scared of asking the very same question to any company working on this. What is Mudlark’s monetisation strategy and the business viability of such strategy? It can’t be simply “let’s build travel profiles of participating users and sell them to advertisers” as TfL would have done that already. And if TfL haven’t thought about this, or if they’re letting Mudlark collect such data without even letting them adhere to some basic T&C, we are in serious trouble. However, it’s the declared strategy by Mudlark that does not convince me. Matthew suggests it might be based on target like “get from Warren Street to Kings Cross by 10 am, show your touch-ins and get a free coffee” or on the idea of “sponsor items” you can buy. Does this strategy have a market that is big enough? And, as I’ve already asked, why should a company pay for this kind of advertisement that is potentially available for free? If the game is successful, however, it will be chaos in the Tube – and I’m really looking forward to it 🙂

Oliver O’Brien, @oobrUCL CASA Researcher

Oliver has recently had his 15 minutes of glory thanks to some amazing live map visualisation of London Barclays Cycle Hire availability. He went further to develop visualisation pages for different bicycle hire schemes all around the world – before he received a Cease&Desist request by one of the companies involved. As a researcher, he provided interesting insight to the GeoMob showing some geo-demographic analysis. For example, weekdays vs weekend usage patterns are different according to the area of the world involved. London is very weekdays-centric, showing that the bicycles are mainly used by commuters. I wonder if this analysis can provide also commercial insight as much as Chromaroma’s intended use of Oyster data.

Thumbs up for the itoworld-esque animation visualizing bike usage in the last 48 hours – stressing that properly done geo-infographic can be extremely useful for problem analysis. Oliver’s future work seems targeted at this, and ideally we’ll hear more about travel patterns and how they affect the usability of bicycle hire schemes. I can’t really understand why he was asked to take some of the maps down.

Eugene Tsyrklevich, @tsyrklevichParkopedia

The main lesson of this presentation: stalk your iPhone app users, find them on the web, question them and make them change the negative reviews.
An aggressive strategy that can probably work – and I would actually describe Parkopedia’s strategy as positively aggressive. They managed to get a deal with AA about branding their parking-space-finding-app in exchange for a share of profit.
Eugene’s presentation was more about business management than development. Nonetheless it was incredibly full of insight. Especially on how to be successful when marketing an iPhone application. “Working with known brands gives you credibility, and it opens doors“. The main door that this opened was actually Apple’s interest in featuring their app on the AppStore, leading to an almost immediate 30-fold increase in sales. This leads to further credibility and good sales: “Being featured gets you some momentum you never lose“. This is a good lesson for all our aspiring geo-developers.

Categories
geo Web 2.0

The past (and future?) of location

I must say – without making it too emotional – that I feel somewhat attached to geo-events at the BCS as my first contact with the London geo-crowd was there over a year ago, with a GeoMob including a talk by the same Gary Gale who gave a talk last night. That was, at least for him, one company and one whole  continent ago – for the rest of us the “agos” include new or matured geo-technologies: Foursquare, Gowalla, Latitude, Facebook and Twitter places, plus our very own London based Rummble, and minus some near-casualties (FireEagle).

Some highlights/thoughts from his talk:

The sad story of early and big players
– early players are not always winners: this can happen in a spectacular way (Dodgeball) or more quietly (Orkut has not technically been a commercial success, for example) – but also
– big players are not always winners: it’s all just a little bit of history repeating, isn’it? Remember the software revolution? The giant IBM didn’t understand it, and a small and agile company called Microsoft became the de-facto monopolist. OS/2 is still remembered as one of the epic fails in software. Remember the Internet revolution? The giant Microsoft had its very own epic fail called Microsoft Network. It took them ages to create a search engine, and in the meantime an agile and young company with a Big G became the search giant. Some years later, the aforementioned Orkut, started by Google as a side project, didn’t have the agility and the motivation to resist to Facebook. The same might happen about location services.

Power to the people
The problem with big players is that they take the quality of data bases for granted. Foursquare et al. found a way to motivate users to keep the POI database constantly updated by using a form of psychological reward. Something that Google hasn’t quite done.

Now monetize, please
Ok, we can motivate users by assigning mayorship and medals. Having a frequently refreshed database is a step ahead. But how do you make money out of it? “Let’s get in touch with the companies and ask for a share of the profit” can work for some brave early adopters. But it will not take long for companies to realize they can use the data – for free – to make business analysis without even contacting foursquare. “Become mayor and get a 10% discount”. What other data analysis should motivate them to pay for it? Knowing where a customer goes next? Where they’ve been before? Maybe to get higher profile in the searches, like in google searches? In the ocean of possibilities, the certainty is that there isn’t yet an idea that works well. “Even Facebook lacks the time to contact the big players to negotiate discounts“. And if you think about the small players it’s even more difficult (but if Monmouth offers me a free espresso I’ll work hard to become their Mayor!).
The way many companies are trying to sell it is still pretty much old economy: sell the check-ins database to a big marketing company, blablabla. Cfr. next point.

Dig out the meaningful data
Ok, we have motivated the users to keep our POIs fresh. But they want to be mayor, so they exploit APIs. Their favourite bar has already a Mayor? They create another instance of the same place. They create their own home. I’ve seen a “my bed”. Is there an algorithmic way to filter out the meaningless data? Surely not in the general case. Moreover, as Gary stressed, simply “selling your database starts eroding its value“. Because the buyer needs to find a use for that mountain of data. As for now, such use is not evident, because most of the data is not meaningful at all.

“If Augmented Reality is Layar, I’m disappointed”
Some time ago I noticed a strange absence of overlap among the geo-crowd and the AR-crowd. The latter presents ideas that have been discussed for years by the former as a “revolution”. One problem is that maybe we have augmented reality but not a realistic augmentation, mostly because of reduced processing power on mobile devices. Ideally you would like to walk down the broadway, see a SuperMario-like green mushroom that gives you an extra shot of espresso (to me it’s like getting an extra-life), catch it, and claim the coffee in the shop around the corner. Unfortunately, GPS is not accurate enough (Galileo might solve this problem soon) and walking down all the time pointing your phone camera to the road will only drain your battery (and probably get you killed before you manage to catch the mushroom). It’s not just an issue of processing power and battery life, though. Even with that, there’s a serious user interaction issue. AR glasses might, partially, solve that, but I can’t really believe that augmenting reality is *just* that and not something that empowers a user’s imagination. Geo-AR is on the boundary between novelty (“oh look, it correctly puts a label on St Paul’s cathedral!“) and utility. And currently on the wrong side of it.

The director’s cut will (not) include recommendations
I’m sure we’ll make it to the director’s cut” – Alex Housley complained in the typical flamboyant way of the Rummble crowd about being left out of the presentation. “We believe trust networks are the future“. Yes and no. I agree with Alex in the sense that how to provide appropriate recommendations is an interesting research problem (but also here)  and the key to monetization of any service. It’s technically not the future, though: Amazon has been using recommendations for years, and I’ve done purchases myself prompted by their recommendations. Trust networks have been extensively used in services like Netflix. What Rummble is trying to do is a more direct way of exploiting trust networks to enrich recommendations, bringing them to the heart of the application. I’m sure that recommendations will play a role in monetizing the geo-thing and that even trust networks may, too. What I’m not sure about is if recommendations will be as they’re now. Without a revolution in the way users perceive local recommendation – that is, a user interaction revolution – they’re not gonna make it. Users need a seamless way of specifying the trust network, and a similarly seamless way of receiving the recommendation.

Categories
geo gov Web 2.0

Free data: utility, risks, opportunities

Some random thoughts after The possibilities of real-time data event at the City Hall.

Free your location: you’re already being photographed
I was not surprised to hear the typical objection (or rant, if you don’t mind) of institutions’ representative when requested to release data: “We must comply with the Data Protection Act!“. Although this is technically true, I’d like to remind these bureaucrats that in the UK being portraited by a photographer in a public place is legal. In other words, if I’m in Piccadilly Circus and someone wants to take a portrait of me, and possibly use it for profit, he is legally allowed to do so without my authorization.
Hence, if we’re talking about releasing Oyster data, I can’t really see bigger problems than those related to photographs: where Oyster data makes it public where you are and, possibly, when, a photograph might give insight to where you are and what you are doing. I think that where+what is intrinsically more dangerous (and misleading, in most cases) than where+when, so what’s the fuss about?

Free our data: you will benefit from it!
Bryan Sivak, Chief Technology Officer of Washington DC (yes, they have a CTO!), has clearly shown it with an impressive talk: freeing public data improves service level and saves public money. This is a powerful concept: if an institution releases data, developers and business will start creating enterprises and applications over it. But more importantly, the institution itself will benefit from better accessibility, data standards, and fresh policies. That’s why the OCTO has released data and facilitated competition by offering money prizes to developers: the government gets expertise and new ways of looking at data in return for technological free speech. It’s something the UK (local) government should seriously consider.

Free your comments: the case for partnerships between companies and users
Jonathan Raper, our Twitter’s @MadProf, is sure that partnerships between companies and users will become more and more popular. Companies, in his view, will let the cloud generate and manage a flow of information about their services and possibly integrate it in their reputation management strategy.
I wouldn’t be too optimistic, though. Albeit it’s true that many longsighted companies have started engaging with the cloud and welcome autonomous, independently run, twitter service updates, most of them will try to dismiss any reference to bad service. There are also issues with data covered by licenses (see the case of FootyTweets).
I don’t know why I keep thinking about trains as an example, but would you really think that, say, Thameslink would welcome the cloud twitting about constant delays on their Luton services? Not to mention the fact that NationalRail forced a developer to stop offering a free iPhone application with train schedules – to start selling their own, non free (yes, charging £4.99 for data you can get from their own mobile web-site for free, with the same ease of use, is indeed a stupid commercial strategy).

Ain’t it beautiful, that thing?
We’ve seen many fascinating visualization of free data, both real-time and not. Some of these require a lot of work to develop. But are they useful? What I wonder is not just if they carry any commercial utility, but if they can actually be useful to people, by improving their life experience. I have no doubt, for example, that itoworld‘s visualization of transport data, and especially those about Congestion Charging, are a great tool to let people understand policies and authorities make better planning. But I’m not sure that MIT SenseLab’s graphs of phone calls during the World Cup Final, despite being beautiful to see, funny to think about, and technically accurate, may bring any improvement to user experience. (Well, this may be the general difference between commercial and academic initiative – but I believe this applies more generally, in the area of data visualization).

Unorthodox uses of locative technologies
MIT Senselab‘s Carlo Ratti used gsm cell association data to approximate people density in streets. This is an interesting use of technology. Nonetheless, unorthodox uses of technologies, especially locative technologies, must be taken carefully. Think about using the same technique to calculate road traffic density: you would have to consider single and multiple occupancy vehicles, where this can have different meanings on city roads and motorways. Using technology in unusual ways is fascinating and potentially useful, but the association of the appropriate technique to the right problem must be carefully gauged.

Risks of not-so-deep research
This is generally true in research, but I would say it’s getting more evident in location-based services research and commercial activities: targeting marginally interesting areas of knowledge and enterprise. Ratti’s words: “One PhD student is currently looking at the correlations between Britons and parties in Barcelona… no results yet“. Of course, this was told as a half-joke. But in many contexts, it’s still a half-truth.

Categories
geo

Cold thoughts on WhereCampEU

What a shame having missed last year’s WhereCamp. The first WhereCampEU, in London, was great and I really want to be part of such events more often.

WhereCampEU is the European version of this popular unconference about all things geo. It’s a nonplace where you meet geographers, geo-developers, geo-nerds, businesses, the “evil” presence of OrdnanceSurvey (brave, brave OS guys!), geo-services, etc.

I’d just like to write a couple of lines to thank everyone involved in the organisation of this great event: Chris Osborne, Gary Gale, John Fagan, Harry wood, Andy Allan, Tim Waters, Shaun McDonald, John Mckerrel, Chaitanya Kuber. Most of them were people I had actually been following on twitter for a while or whose blog are amongst the ones I read daily, some of them I had alread met in other meetups. However, it was nice to make eye-contact again or for the first time!

Some thoughts about the sessions I attended:

  • Chris Osborne‘s Data.gov.uk – Maps, data and democracy. Mr Geomob gave an interesting talk on democracy and open data. His trust in democracy and transparency is probably quintessentially British, as in Italy I wouldn’t be that sure about openness and transparency as examples of democratic involvement (e.g. the typical “everyone knows things that are not changeable even when a majority don’t like them“). The talk was indeed mind boggling especially about the impact of the heavy deployment of IT systems to facilitate public service tasks: supposed to increase the level of service and transparency of such services, they had a strong negative impact on the perceived service level (cost and time).
  • Gary Gale‘s Location, LB(M)S, Hype, Stealth Data and Stuff
    and Location & Privacy; from OMG! to WTF?. Albeit including the word “engineering” in his job title, Gary is very good at giving talks that make his audience think and feel involved. Two great talks on the value of privacy wrt location. How much would you think your privacy is worth? Apparently, the average person would sell all of his or her location data for £30; Gary managed to spark controversy amidst uncontroversial claims that “£30 for all your data is actually nothing” – a very funny moment (some people should rethink their sense of value, when talking about UK, or at least postpone philosophical arguments to the pub).
  • Cyclestreet‘s Martin Lucas-Smith‘s Cyclestreets Cycle Routing: a useful service developed by two very nice and inspired guys, providing cycling route maps over OpenStreetMaps. Their strenght is that the routes are calculated using rules that mimick what cyclists do (their motto being “For cyclists, By cyclists“). Being a community service, they tried (and partially managed) to receive funding by councils. An example of an alternative – but still viable – business model.
  • Steven Feldman‘s Without a business model we are all fcuk’d. Apart from the lovely title, whoever starts a talk saying “I love the Guardian and hate Rupert Murdoch” gains my unconditional appreciation 🙂 Steven gave an interesting talk on what I might define “viable business model detection techniques“. As in a “business surgery” he let some of the people in the audience (OrdnanceSurvey, cyclestreetmaps, etc…) analyze their own business and see weaknesses and strenghts. A hands-on workshop that I hope he’s going to repeat at other meetings.
  • OpenStreetMap: a Q&A session with a talk from Simone Cortesi (that I finally managed to meet in person) showing that OSM can be a viable and profitable business model. Even stressing that they are partially funded by Google.

Overall level of presentations: very very good, much better organised than I was expecting. Unfortunately I missed the second day, due to an untimely booked trip 🙂

Maybe some more involvement from big players would be interesting. Debating face to face about their strategy, especially when the geo-community is (constructively) critical on them, would benefit everyone.

I mean, something slightly more exciting than a bunch of Google folks using a session to say “we are not that bad” 🙂

Categories
geo geomob mobile Web 2.0

A bunch of nerds with maps

…I think I can define GeoMob this way and I fit this definition perfectly 🙂

Nice London Geo/Mobile Developers Meetup Group meeting yesterday at City University. High level of the talks, providing vision, reporting experiences, and showing technologies and nice uses of them. Here’s a short summary.

Andrew Eland – Mobile Team Lead for Google UK

A very Google-like talk, showing up tech pieces with their vision. Of course, disappointing if you were expecting more in-depth analysis of market, novel ideas, or anything more than current publicly known work. But we’re used to that, and it was not a bad talk at all 🙂
Best quote: “Tokyo is a vertical city“. That’s absolutely true, and this fact has a direct impact on geo-apps: being shops, clubs, bars, developed vertically at different levels of the buildings (this is a pic I took of the Keio Sky Garden, for example, and there are hundreds of beer gardens up on the roofs of several skyscrapers!) there’s a real need for accurate altitude information and 3d-mapping, or at least altitude-enabled maps. The interesting question for me here is how we can show multi-floor information on the 2d-maps currently in use.

Julianne Pearce, Blast Theory
An artists’ collective perspective on geo-development. Absolutely intriguing, as not the average techietalk you would expect from a GeoMob. I found this personally interesting, as I played with the Can you see me know? game and even created a modified version of it at the UbiComp Spring School at Mixed Reality Lab, University of Nottingham in April 2009, during a workshop dealing with Locative Game Authoring.

PublicEarth
They introduced their concept of a web 2.0 site for creating a personal atlas. Basically it’s about putting photographs and commercial activities of interest on a personal map. They seem to be developing APIs and the possibility of creating widgets, and directly deal with small companies (hotels, b&b, restaurants, bars) to put them in their database. The idea here is that users will be allowed to tell the (possibly intelligent) system what categories of data they’re mostly interested in, leading to some kind of customised Michelin guide.
On monetization, they have a three-fold strategy:
– contextual advertisement, empowered by the fact that users are genuinely interested in what they put in their atlas
– share of profit on direct bookings
– [long-term] user base providing more content, improving quantity and quality of contextual data in a positive feedback loop, possibly making it interesting to other companies

Laurence Penney, SnapMap
My favourite talk of the night. Laurence has been longing for a way of placing precisely photographs on a map for more than 10 years.
I was astonished of seeing him doing many of the things I would have liked to see in web sites like Flickr and that I’ve been discussing for ages with my friends and colleagues! Using gps data, a compass, waypoints, directions, focal length, and all the other data associated with a photograph, Laurence is developing a web site to allow users navigate those pictures, even creating 3d views of them like the guys at University of Washington with Rome wasn’t built in a day. Funnily, he started all of these before gps/compass-enabled devices were available, writing down all of his data on a notebook, and he even had problems with the police inquiring why he was taking picture at the Parliament (unfortunately, I have to say he’s not alone -_-).

Mikel Maron – Haiti Earthquake OpenStreetMap Response
Mikel explained what OpenStreetMap did to help in Haiti. Disaster response relies heavily on updated maps of building, streets, and resources, and OSM quickly managed to get that done. A great thanks to him and to all of OSM guys to show the world that mapping can be helpful to people even leaving out profit considerations.